Infographics are all the rage and we think they are fantastic also. They are particularly good for law, which can be a complex subject and involves a lot of factual information.
With personal injury and accidents, statistics suggest that, when looking for compensation claim advice, those looking want to know about the data such as how common accidents are, what compensation may be available and so on, so infographics are particularly helpful in this respect.
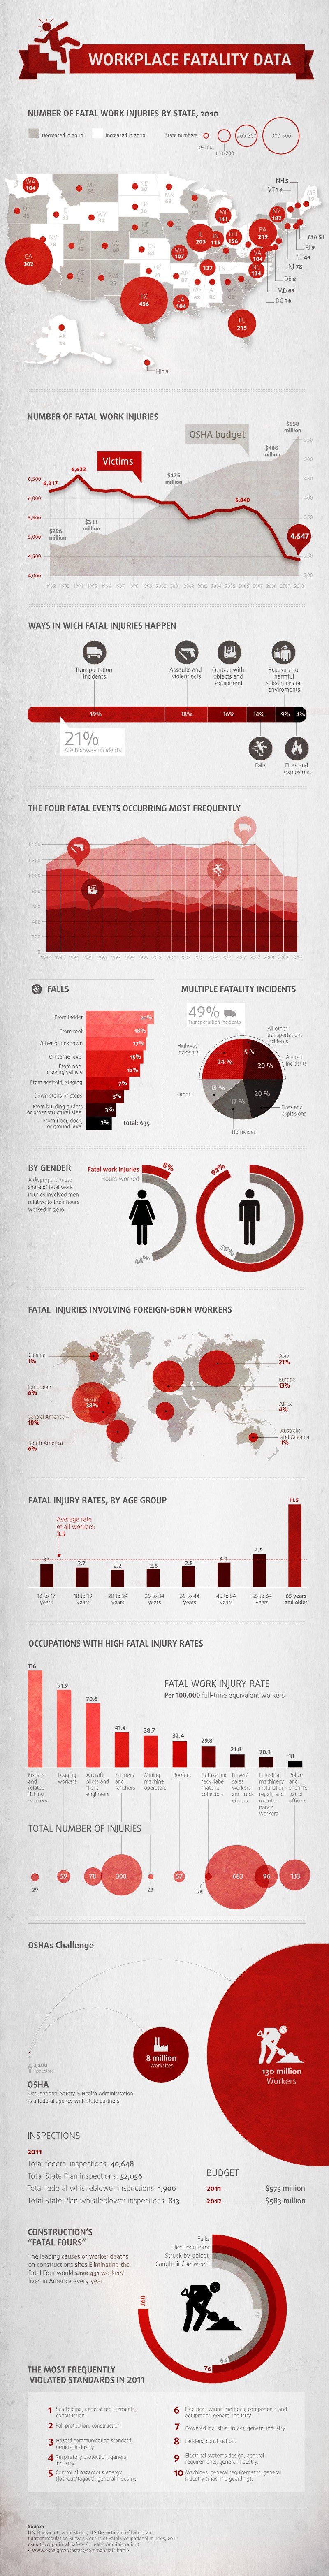
There have been very few infographics created so far by UK law firms. We believe this is set to change and we are in fact working on come ourselves at the moment. In the meantime, below is an excellent infographic very recently produced by Compliance and safety.
Clearly, ads the infographic shows, working at height is the number 1 cause of fatal accidents. It also shows that in the US, the number of fatalities is decreasing, which is good news.
What do you think about this data ? Do you agree that this is an excellent way of clearly demonstrating a lot of data in a very accessible way ?